
Likert scale analysis means summarising ordered agreement responses honestly: report the frequency of each answer for single items, combine related items into a scale score only after reverse coding and checking them, then report the mean and standard deviation of that score with the number of respondents. State your scoring rule and any cut-offs in Chapter 3.
UniDraft helps you write this part up properly. It organises your confirmed methods, the analysis outputs you checked and your supervisor's instructions into an editable Word document. Start your project document once your tables are verified; the analysis itself is yours to run in SPSS, Excel or a similar tool, and UniDraft does not calculate it for you.
What is a Likert scale, and what is a Likert item?
Students often use "Likert scale" for everything on a questionnaire that has Strongly Disagree to Strongly Agree. Methodologists separate two things, and the separation drives the whole analysis:
- Likert item (Likert-type item): one statement with an ordered response set, such as "My lecturers' feedback is clear" with five options.
- Likert scale: a set of related items combined, usually summed or averaged, into one score for a concept such as satisfaction with feedback.
Sullivan and Artino's editorial in the Journal of Graduate Medical Education describes the typical Likert scale as a 5- or 7-point ordinal agreement scale and notes that researchers often group several items into a survey scale and compute a total or mean score, especially for abstract concepts. They advise checking that the grouped items are intercorrelated and measure the same construct (for example with Cronbach's alpha or factor analysis). That check is covered in the validity and reliability guide, so this article does not repeat it.
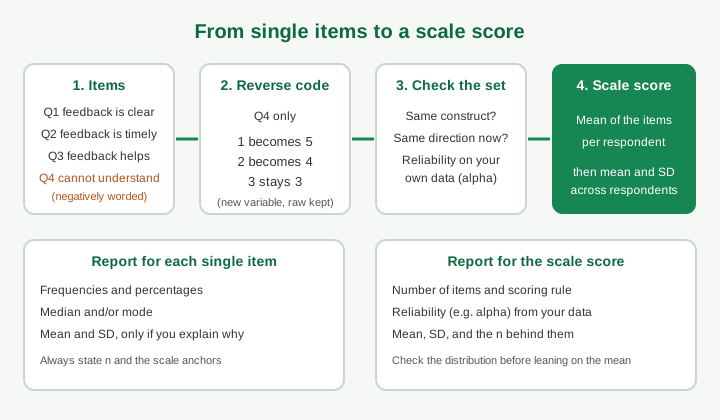
Step 1: Decide, objective by objective, what you are analysing
Before touching software, write next to each objective whether it needs an item-level answer or a scale-level answer.
| Your objective says | You probably need | Because |
|---|---|---|
| "Identify the challenges students face with feedback" | Item-level frequencies, ranked | Each challenge is its own question |
| "Determine the level of satisfaction with feedback" | A scale score from several items | Satisfaction is a concept, not one statement |
| "Compare satisfaction between 200- and 300-level students" | A scale score, then a comparison | You need one number per student to compare groups |
If your questionnaire was designed around objectives, this table is easy to fill; if not, the questionnaire design guide shows how to map items to objectives. A Chapter 4 table that reports twenty separate item means for an objective about "overall satisfaction" is the usual sign that this step was skipped.
Step 2: Code and clean first
Likert responses need a documented numeric coding, normally 1 to 5 from Strongly Disagree to Strongly Agree, with the same direction for every item. Keep unanswered items as missing rather than entering a neutral 3, and keep the raw export untouched. The questionnaire coding and cleaning guide walks through the codebook, range checks (a 7 on a 1 to 5 item) and the cleaning log. Do those before calculating anything, because every mean below depends on them.
Step 3: Reverse code negatively worded items
Good questionnaires sometimes include a negatively worded item, for example "I often cannot understand the comments on my work". Agreement here means less satisfaction. If you average it with positively worded items without reversing it, the scale score mixes opposite meanings.
For a 5-point scale the reversal is: 1 becomes 5, 2 becomes 4, 3 stays 3, 4 becomes 2, 5 becomes 1. A quick formula is (highest code + lowest code) minus the original value, so 6 minus the original.
Practical rules:
- Create a new variable (for instance
q4_rev) and leave the raw one alone. - Reverse only the items that point the opposite way, and write each reversal in the codebook.
- After reversing, check the new item's frequencies are the mirror image of the old ones. If they are not, the formula was applied wrongly.
- Report reliability after reversing, not before. A forgotten reversal is one of the commonest reasons an item looks like it "does not fit" the scale.
Step 4: Report single items with frequencies
For a single item, the most transparent report is the full distribution: how many and what percentage chose each option, with the number of valid responses. Sullivan and Artino suggest that frequency distributions are often more helpful than a single average, and that overly precise decimals are rarely informative.
State the denominator. If 50 students were sent the form and 50 answered this item, say n = 50. If three skipped it, say n = 47 and calculate percentages from 47. The Chapter 4 guide shows how to explain which denominator you used.
Combining "Agree" and "Strongly Agree" into "total agreement" is common and fine, if you say you did it and also show the original categories, so a reader can see you did not hide a split.
Step 5: Build a scale score, then report mean and standard deviation
For a scale, compute each respondent's score as the mean of their items (after reversal). A mean keeps the score on the original 1 to 5 metric, which is easier to read than a total out of 20. Decide up front how to handle a respondent who skipped one item; one common approach is to require most items answered, but the right rule depends on your instrument and supervisor, so write down whatever you choose and apply it to everyone.
Then report, for the group:
- Mean: the average of the scale scores.
- Standard deviation (SD): how spread out the scores are around that mean. A mean of 3.7 with an SD of 0.4 describes a very different group from a mean of 3.7 with an SD of 1.2, where opinions are split.
- n: the number of respondents with a valid scale score.
- The number of items and the scoring rule.
A mean without an SD and an n is an incomplete result, and "mean = 3.71" reported to four decimals suggests more precision than five-point agreement answers carry. Two decimal places is a common compromise.
The fictional worked table
This table is invented to show the method. It is not real data, a real study or a real department. Suppose 50 students answered four items on a "feedback" scale. The fourth item is negatively worded.
| Item (1 = SD, 5 = SA) | SD | D | N | A | SA | Mean | SD (spread) |
|---|---|---|---|---|---|---|---|
| Q1 Feedback is clear | 2 | 5 | 8 | 22 | 13 | 3.78 | 1.08 |
| Q2 Feedback is timely | 4 | 9 | 12 | 17 | 8 | 3.32 | 1.19 |
| Q3 Feedback helps me improve | 1 | 3 | 6 | 24 | 16 | 4.02 | 0.94 |
| Q4 raw: I cannot understand the comments | 14 | 20 | 7 | 6 | 3 | 2.28 | 1.18 |
| Q4 reversed (6 minus raw) | 3 | 6 | 7 | 20 | 14 | 3.72 | 1.18 |
How to read it:
- Reversal flips the count in each category (14 students who strongly disagreed that they cannot understand comments now score 5) and turns the mean 2.28 into 3.72, which is 6 minus 2.28. The SD does not change, because reversal only mirrors the data.
- The scale mean here is the average of the four item means after reversal: (3.78 + 3.32 + 4.02 + 3.72) / 4 = 3.71. This shortcut works only when every respondent answered every item; with missing answers, calculate each person's score first in your software.
- The scale SD needs each respondent's own score, so it cannot be worked out from the table above. Your software gives it. Do not copy the item SDs into the scale row.
- Q2 has a mean of 3.32, which sounds lukewarm. The distribution says more: 50 per cent agree or strongly agree (17 + 8 of 50) and 26 per cent disagree or strongly disagree (4 + 9 of 50). That is the reason to show frequencies beside means.
A results sentence from this: "Item Q1 was rated positively, with 35 of 50 respondents (70%) agreeing or strongly agreeing (M = 3.78, SD = 1.08)." Every number there traces to a row of the table; yours must trace to your real output.
How do I interpret a mean score? Why cut-offs vary
Many Nigerian projects interpret means with a table such as "1.00 to 1.80 = Strongly Disagree" up to "4.21 to 5.00 = Strongly Agree". The widely seen logic is to divide the range of the scale (5 minus 1 = 4) by the number of categories (5), giving bands about 0.80 wide. The sources opened for this guide do not prescribe that rule, so treat it as a common convention rather than a standard. Authors also vary in where they place the boundaries (some put them at 1.80, 2.60, 3.40 and 4.20; others round to the nearest whole point), which is exactly why the rule must be stated and justified.
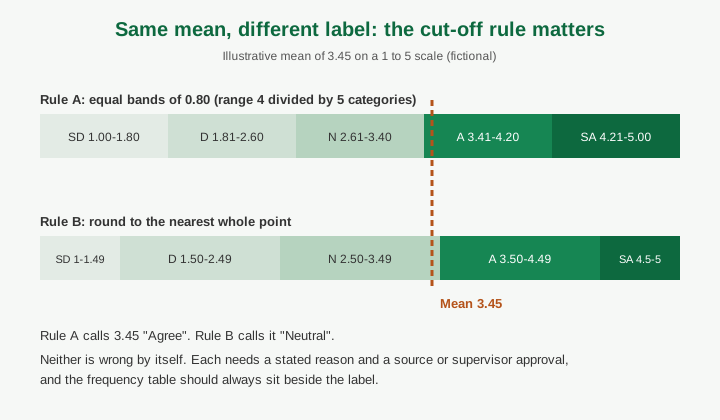
The figure shows why this matters: the same fictional mean of 3.45 is "Agree" under one rule and "Neutral" under another. So:
- Choose one rule before looking at the results, to avoid picking whichever band flatters the finding.
- Justify it in Chapter 3: cite a source you have read, or tell the reader your supervisor or department approved it.
- Use the label as a convenience, not the finding. The frequencies and the SD remain the evidence.
- Use the same rule for every item and scale, and keep the labels consistent with your anchors.
If your department hands you a mandatory table of cut-offs, use that and cite the instruction. That overrides anything in this guide.
The ordinal-data debate in plain terms
A single Likert item is ordinal: you know "Agree" is higher than "Neutral", but not that the gap from Neutral to Agree equals the gap from Disagree to Neutral. Sullivan and Artino put it as the distance between responses not being measurable. A strict reading says you should not average ordinal codes, because averaging assumes equal gaps.
The other side, represented by Geoff Norman's review in Advances in Health Sciences Education, argues from simulations and studies going back decades that parametric methods such as ANOVA, regression and correlation are robust to ordinal data, small samples and non-normality, so researchers need not avoid them. Sullivan and Artino summarise the practical middle ground: parametric tests can be used with Likert data, but means are of limited value unless the data are roughly normal, and authors should explain their descriptive and analytic choices in the methods.
What this means for you:
- Single items: frequencies are safe. Median or mode are defensible. A mean is common but needs a sentence of justification.
- Multi-item scale scores: the mean and SD are widely used. Look at a histogram first; if almost everyone sits at 4 or 5, the mean hides that.
- Choosing a test: if you compare groups or relationships, a rank-based test and a parametric test are both discussed in the literature; the statistical test guide covers matching the test to the design, and the correlation table worksheet helps you read the output. Ask your supervisor which they expect.
A panel will not usually fail you for either choice. It will question a choice you cannot explain.
What to write in Chapter 3
Keep it short and factual, and fill each bracket only with what actually happened:
"Responses were coded 1 (Strongly Disagree) to 5 (Strongly Agree). Negatively worded item(s) [numbers] were reverse coded. Scale scores were computed as the mean of [number] items for each respondent; internal consistency was assessed with Cronbach's alpha ([value]). Single items are reported as frequencies and percentages; scale scores as mean and standard deviation. Mean scores were interpreted using [stated rule and source or supervisor approval]."
That paragraph belongs in the methodology chapter. The sample size guide explains why the n behind each mean matters.
Common mistakes supervisors flag
| Mistake | How it gets questioned |
|---|---|
| Averaging items without reversing negatives | "Does a high score mean good or bad here?" |
| Reporting only means, no frequencies or n | "How many answered, and how were they spread?" |
| Calling a single item "interval data" without a reason | "Why is a mean appropriate for one ordinal item?" |
| Cut-off table copied from another project with no source | "Where do these bands come from?" |
| Mean to four decimals | "Is this precision real?" |
| Pooling all items into one score though they measure different ideas | "What construct does this total represent?" |
| Treating 3 as 'neutral' when it was really 'missing' | "How were blanks coded?" |
| Describing 3.4 as 'strongly agree' because it is above average | "Check your own anchors." |
Questions a panel may ask
- Why did you use the mean for this item rather than the median?
- Which items did you reverse code, and how do you know it was done correctly?
- Where do your interpretation bands come from?
- How many respondents answered each item, and what happened to the incomplete forms?
- What does an SD of 1.2 tell us here?
- Does the scale measure one idea, and how do you know?
Having the answers written in your notes beforehand is better than improvising. The project defence questions guide has more on preparing for these.
Pre-submission checklist
- Every Likert item is coded in a documented direction and negatives are reversed in new variables.
- Each objective is matched to item-level or scale-level reporting.
- Item tables show frequencies, percentages and n.
- Scale scores state the number of items, the scoring rule and the missing-data rule.
- Means come with SDs and n, rounded sensibly.
- The interpretation rule is chosen in advance, justified and applied consistently.
- Reliability was calculated on your own data, for each scale.
- Your supervisor has agreed the ordinal-versus-parametric choice.
- Every number in Chapter 4 comes from your real data.
Where UniDraft fits in
UniDraft does not run your analysis or check your SPSS output. What it does is take the methods, tables and interpretations you have confirmed, together with your supervisor's instructions and your department's format, and organise them into an editable Word document, with earlier versions kept when corrections come back. Check the current project price and the included correction rounds before checkout. For the Chapter 4 write-up, prepare your project document from your actual results, and use the free formatting checker to look at fonts, spacing and margins in your Word file.
Sources
- Sullivan and Artino (2013), Analyzing and Interpreting Data From Likert-Type Scales, Journal of Graduate Medical Education: Likert items versus scales, ordinal data, frequencies, means and parametric tests, and reporting choices in Methods.
- Norman (2010), Likert scales, levels of measurement and the "laws" of statistics, Advances in Health Sciences Education (PubMed record): the argument that parametric methods are robust with Likert data.
- Jamieson (2004), Likert scales: how to (ab)use them, Medical Education (University of Glasgow record): the commentary on how Likert-type scales are analysed in medical education. Only the bibliographic record (no abstract) was readable, so this guide does not rest any claim on it; the ordinal-versus-interval debate is described from Sullivan and Artino and Norman.