A survey research design is your plan for who you ask, how you reach them, when you ask, and what the answers are allowed to prove. The questionnaire is only one part of it. Decide timing (one snapshot or repeated rounds), purpose (describe or relate), mode, sampling frame and response plan first, then write the questions.
If your design is settled, UniDraft can help you write it up. It organises your confirmed design decisions, real results, checked sources and supervisor instructions into an editable Word project document. Start your project document, and bring the response counts and limitations you can verify. It does not run your survey or your analysis.
This guide is about the design decision. For the items themselves, see how to design a questionnaire.
For the number of respondents, use the sample-size guide. Selection is in the sampling techniques guide. Here we cover what sits above all three.
What does "survey design" actually mean?
Students often hear "survey" and think "questionnaire". They are different things.
| Term | What it is |
|---|---|
| Survey research design | The overall strategy: purpose, timing, population, frame, mode, response plan and claims |
| Questionnaire | The instrument: the written items respondents answer |
| Sampling | How people on the list are chosen to be invited |
| Platform | The tool that delivers the questionnaire (paper, a form, an interviewer) |
The USC Libraries research-design guide describes design as the strategy that connects your research problem to the evidence you gather. A survey is one strategy among several. If you have not yet decided between survey, case study, experiment or content analysis, start with the research design chooser and come back once survey is the right fit.
Surveys fit questions about attitudes, reported behaviour, awareness, experience and characteristics across many people. They fit poorly when you need to observe what people actually do, when the group is tiny, or when you need to understand a situation in depth. For those, consider interviews or a case study.
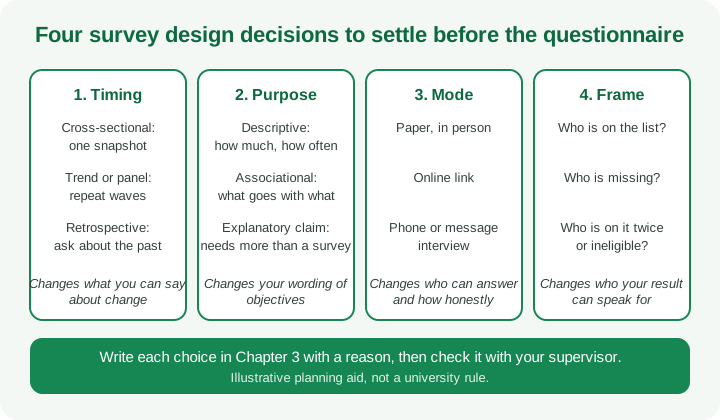
Decision 1: one snapshot or repeated rounds?
Timing is the first design choice, and it decides what you can say about change.
- Cross-sectional: you survey a group once. You get a snapshot at one point in time. Sources on research design note that this is relatively quick and inexpensive, can use many respondents, and can estimate how common something is, but it shows no sequence of events and cannot establish cause and effect.
- Longitudinal: you measure over time. There are several versions. A trend design draws different respondents each round from the same population. A panel design re-surveys the same people. A cohort design follows people who share a defining experience. Longitudinal designs can measure change, but they are slow, and keeping the same people in the study is hard.
- Retrospective: you survey once and ask about the past. This borrows some of the benefit of a longitudinal design without repeated fieldwork, but memory is imperfect.
For a typical final-year timetable, cross-sectional is the usual practical choice. That is fine, if you do not write conclusions about change over time or about what caused what. A frequent mistake is writing "the introduction of X improved Y" from a single round of data. A cross-sectional survey can say "students who reported using X also reported higher Y". Those are different sentences.
If your supervisor expects before-and-after evidence, ask whether the timetable allows two rounds, or whether you should narrow the claim.
Decision 2: describing, relating or explaining?
State the purpose of your survey in one verb.
| Purpose | Typical objective wording | What the survey gives you |
|---|---|---|
| Describe | "To determine the level of..." "To identify the common..." | Counts, percentages, averages for one group |
| Compare | "To compare ... between ..." | Differences between groups at one time |
| Relate | "To examine the relationship between..." | Association between variables |
| Explain a cause | "To determine the effect of..." | A claim a survey alone usually cannot support |
The last row is where many projects get into trouble. Objectives written with "effect of" or "impact of" promise causal evidence. A one-time survey generally cannot deliver that, because it cannot show that the cause came first or rule out other explanations. You have two honest options: rewrite the objective as a relationship ("the relationship between X and Y"), or adopt a design that can support the stronger claim and ask your supervisor whether it is feasible.
Your objectives, research questions and hypotheses should match the purpose. The research questions and objectives guide shows how to word each, and the hypotheses guide covers testable statements.
The statistical test guide then helps you check that the planned analysis fits the purpose.
Decision 3: how will people answer?
The mode of administration is how the questionnaire reaches respondents. Common modes include paper questionnaires handed out in person, online forms, telephone or message-based interviews, and face-to-face interviews. Survey methodology sources note that the right choice depends on cost, coverage of your target population, how flexible the questions need to be, willingness to take part and the accuracy of answers, and that different modes can change how people answer.
For a Nigerian student project, think through these practical questions rather than assuming one mode is best:
- Can your whole target group be reached this way? An online link reaches people with a phone, data and a reason to open it. If part of your group lacks reliable data access or is not in your WhatsApp groups, they are structurally less likely to appear in your results.
- Who might help a respondent answer? A printed form filled in a queue or in front of a lecturer can change answers on sensitive topics.
- Is the topic sensitive? People may answer differently when an interviewer is present than when alone with a form.
- What can you handle? Handing out and collecting paper forms takes time, and typing them in is its own task; see the data coding and cleaning guide.
- What will your ethics process need? Consent works differently on paper and on a form; see the research ethics and consent guide.
A mixed approach is allowed, for example paper forms for people you meet in person and a link for the rest, but then record which mode each response came from, and check whether the answers differ by mode before combining them. If you use Google Forms, the Google Forms guide covers access and privacy checks. The form is delivery, not design.
Decision 4: who is on your list, and who is missing?
The sampling frame is the actual list or source from which you draw people to invite. It is not the same as the population you care about. The gap between the two is called coverage error: some members of the target group are not on the frame and may differ from those who are.
Examples of frame problems in student surveys:
- You want "all final-year students in the faculty" but the only list you can get is a class WhatsApp group. Members who left or never joined are off the frame.
- You want "customers of a market" but you survey only people at the front stalls.
- You want "patients" but survey only those present on clinic mornings.
None of these makes a project invalid. They make the claim narrower. Write the frame honestly: "The frame was the departmental list of 214 registered 400-level students supplied by the course adviser" is a design statement. "The population was all students in Nigeria" is not.
Ask three questions about any frame: Who is missing? Who appears twice? Who is on it but not eligible? Then decide how you will handle each. Selection from the frame is covered in the sampling guide.
Decision 5: what response will you realistically get?
The most honest section in many strong Chapter 3 write-ups is the one about response. Plan it before you start.
The usual pathway looks like this, and each step can lose people:
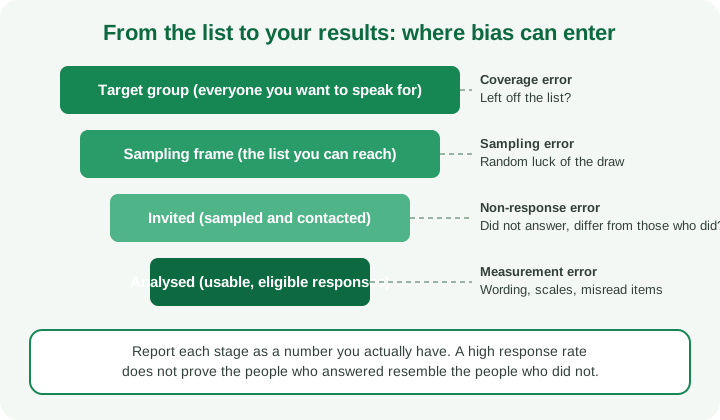
Survey-error writing commonly separates four kinds of error: coverage (people left off the frame), sampling (random variation from surveying only part of the frame, which shrinks as numbers grow), non-response (people who do not answer, or drop out, and who may differ from those who do) and measurement (wording and scales that capture something other than what you intended). See MeasuringU's summary of the four survey errors.
Two practical points follow.
A response rate is not a bias measure. A high response rate lowers the risk, but it does not remove it. What matters is whether the people who did not answer differ from those who did on what you are measuring. For example, if an income question makes some respondents abandon the form, your results can skew even when most people finished. So report the numbers (invited, returned, usable) and discuss who may be missing and in which direction your results could be pushed.
Do not treat a calculated sample size as a promise. The number from a formula is a target. You may reach fewer or more. Plan extra invitations, as the sample-size guide explains, and report what you actually obtained. If the shortfall is large, say so and explain the effect on your claims. Panels check this kind of honesty, and it is far easier to defend than a number the data does not support.
Practical ways to raise response without bending the rules (all subject to your ethics approval and supervisor):
- Keep the questionnaire as short as your objectives allow.
- Explain who you are, what the study is for and how long it takes.
- Make the first questions easy.
- Allow a reasonable window and follow up with the people you were allowed to invite.
- Never pressure, reward in ways not approved, or make participation feel compulsory.
What can a survey prove, and what can't it?
This is the question to answer for yourself before your defence panel asks it.
| A survey can reasonably support | A survey cannot, on its own, support |
|---|---|
| Describing the people who answered | Speaking for people who could not be reached |
| Showing how common a reported behaviour or opinion is in your group | Proving that what people said is what they did |
| Showing that two variables move together | Showing that one causes the other |
| Comparing groups at one time | Showing that a group changed over time (needs repeated measurement) |
| Generating ideas for further study | Confirming a cause or a policy effect |
Notice that every right-hand cell is a limitation to state, not a failure. A well-argued limitations section shows you understand your design. If you used an open link shared in groups, say that respondents chose themselves, and avoid applying a random-sampling margin of error to it simply because a calculator returned one.
Another trap is measurement: a stack of items does not measure a concept just because it looks like it does. Check that your scales are validated or piloted; see the validity and reliability guide and the pilot study guide.
A fictional worked design
The scenario below is invented to show the reasoning. It is not a real study, and the numbers are illustrative.
Student: Ada, a Business Administration student at a fictional university, "Riverbend University". Topic direction: how final-year students in her faculty pay for non-tuition academic costs, and whether payment method relates to reported payment delays.
| Design decision | Ada's choice | Reason and limit |
|---|---|---|
| Timing | Cross-sectional, one round in a two-week window | Fits the timetable. She cannot claim change over time |
| Purpose | Describe payment methods and relate method to reported delays | Objectives worded as "extent" and "relationship", not "effect" |
| Target group | Final-year students in the Faculty of Management Sciences | Matches the question |
| Frame | The departmental final-year lists supplied by the faculty office: 640 names across four departments (fictional) | Better than a class WhatsApp group; students who deferred or are off the lists are missing, which she records as a limit |
| Selection | Stratified by department, then a documented random draw within each list | Described step by step in Chapter 3; see the sampling guide |
| Mode | Paper form at lecture venues, plus an online form for selected students not reached after two visits | Reduces the online-only bias; mode recorded for every response |
| Piloting | A small pilot with a few students outside the sample | Tests wording and timing before launch |
| Response plan | Planned extra invitations over the target; one reminder to selected students only | Counts recorded: invited, returned, unusable, analysed |
| Claims | "Students who used X reported Y more often", with limitations | No claim that payment method caused delays |
Now see what Ada writes in the limitations section (illustrative wording):
The frame excluded students not on the faculty office lists. The study is cross-sectional, so it shows associations at one point in time and cannot show whether payment method preceded delay. Students who did not return the questionnaire may differ from those who did; the number invited, returned and analysed is reported in Table 4.1.
That paragraph protects her at the defence because every limit is named and tied to a design decision.
Questions a defence panel may ask
- Why a survey and not interviews or documents?
- Why cross-sectional? What does that stop you claiming?
- How did you define your frame, and who is missing from it?
- How many did you invite, how many returned, how many did you analyse?
- How do you know non-respondents are not different?
- Why did you word your objective as "relationship" rather than "effect"?
- Could mode have affected how honestly people answered?
Prepare two or three sentences for each, using your real numbers. Cite the sources behind your design choices properly with UniDraft's citation tools. The defence questions guide helps you rehearse.
Common mistakes
- Treating the questionnaire as the whole design.
- Writing "effect of" objectives from a one-time survey.
- Naming the population as everyone, while the frame is one group chat.
- Applying a formula-based margin of error to an open-link convenience sample.
- Reporting the target sample as if it were the achieved sample.
- Hiding the response rate, or reporting a rate without saying how it was calculated.
- Mixing paper and online responses without recording the mode.
- Skipping a limitations section, or writing generic limits not tied to your design.
A design checklist for Chapter 3
Before you submit your methodology to your supervisor, confirm that it states:
- The survey purpose in one verb.
- Cross-sectional or repeated, and why.
- The target group and the actual frame, with its source.
- Eligibility rules and how duplicates were handled.
- Mode of administration and how mode was recorded.
- How people were selected and invited.
- A response plan and the final counts.
- How you will treat missing and unusable responses.
- What the design allows you to claim, and what it does not.
- Ethics and consent steps, as required by your institution.
Whole-chapter structure is covered in the methodology guide. Requirements differ between institutions and departments, so use these as planning aids and follow your own supervisor's and department's brief.
Where UniDraft fits
UniDraft does not design your survey, collect responses or run your statistics. After you have decided your design and have real results, it organises your confirmed methodology decisions, response counts, checked sources and supervisor instructions into an editable Word project document, so that Chapter 3 and Chapter 4 tell the same story. Start your project document when your design is agreed, and review every claim and number yourself.
Sources
- USC Libraries, Research Guide: Types of Research Designs, for cross-sectional, longitudinal, descriptive and causal design strengths and limits.
- MeasuringU, Four Types of Potential Survey Errors, for coverage, sampling, non-response and measurement error.
- Wikipedia, Survey methodology, for modes of data collection, sampling frames and longitudinal attrition (a general overview; check primary methods texts for citation in your report).
The fictional design, tables and checklist are original planning aids and are not institutional requirements.