
Quantitative research methods collect data as numbers, or as categories you can count, and analyse it with statistics to describe a group, compare groups, test a relationship or measure the effect of a change. In a final year project the main routes are a survey, an experiment, or analysis of existing data.
This guide is the overview and decision guide: it helps you pick a route and shows what that choice forces on the rest of your methodology. When you have written down your design, variables, sample and tests, UniDraft can organise those confirmed decisions, your checked sources and your supervisor's instructions into an editable Word document. Start your project document with UniDraft. It does not run your analysis or choose your design for you.
What makes a research question quantitative?
A question is quantitative when a reasonable answer can be expressed as a number, a proportion, a difference between groups or a measured relationship. The wording gives it away.
| Question wording | Why it is quantitative | What the answer looks like |
|---|---|---|
| How many students in the faculty use mobile banking weekly? | Asks for a count or proportion | "About 6 in 10 respondents" (illustrative) |
| Is average attendance higher in Class A than Class B? | Compares a measured value between groups | A difference in means |
| Is hours of study related to test scores? | Asks about a relationship between two measured variables | A correlation coefficient |
| Did the new revision timetable change scores? | Asks about an effect of a deliberate change | Before and after scores, ideally with a comparison group |
| Why do students feel anxious about defence? | Asks for reasons and meanings | Themes, so this leans qualitative |
The USC Libraries guide to quantitative methods describes the approach as objective measurement and numerical analysis of data from sources such as questionnaires and surveys, or from existing statistical data, with the aim of generalising to groups or explaining a phenomenon. It also lists limits: numbers can miss context, researcher-designed questions can carry bias, and a result can be statistically significant yet unimportant in real life.
If your question starts with "why" or "how do people experience", pause. That is usually a qualitative question, and mixed methods may suit you if your department allows it.
The three quantitative routes side by side
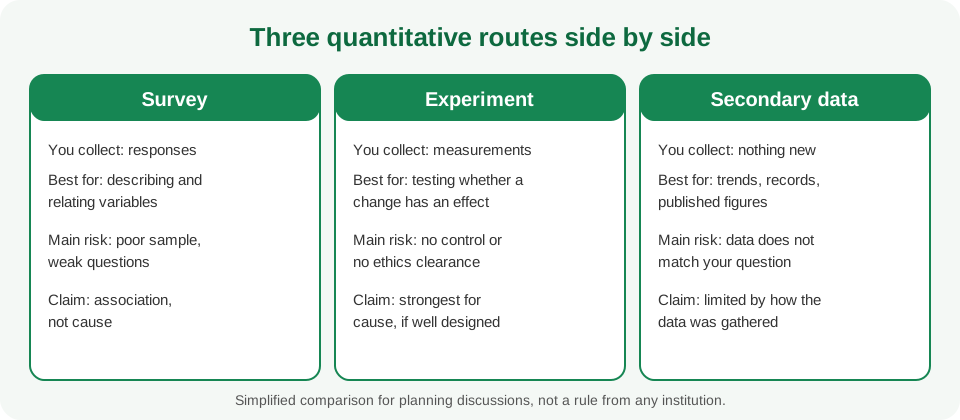
Most Nigerian undergraduate projects sit in one of these three columns. They are not rivals; they answer different questions.
Survey
You ask a group of people the same structured questions and code the answers. It is the most common route because it needs no laboratory and fits questions about opinions, behaviour, awareness and usage. Its weakness is that it can show association but not cause, and its quality depends on who answered and how the questions were worded. The mechanics of building the instrument are in how to design a questionnaire, and the cleaning step afterwards is in coding and cleaning questionnaire data.
Experiment
You deliberately change something (a teaching method, a fertiliser rate, a software setting) and measure the outcome, ideally against a comparison group. The USC guide notes that experimental designs measure subjects before and after a treatment and aim to establish causality. It is the strongest route for "did this change work?" and also the heaviest: you need materials, time, a defensible comparison and, where people are involved, ethics clearance. See research ethics and consent before you touch any participants.
Secondary data analysis
You analyse data someone else collected: published statistics, institutional records, financial statements, a public dataset. It suits questions about trends and relationships over time or across organisations, and it saves collection time. The risk is mismatch: the data may not measure the thing your question names, and you inherit whatever errors its collectors made. The USC guide says researchers must still report how the data were gathered and address missing data. The source-checking steps are in primary and secondary data.
How do I choose between them?
| If your question is about... | Lean towards | Check first |
|---|---|---|
| What people think, do or know | Survey | Can you reach a fair sample of the group? |
| Whether an intervention changed an outcome | Experiment or quasi-experiment | Can you create a fair comparison and get clearance? |
| Patterns over time or across firms or regions | Secondary data | Does the dataset measure your concept and cover your period? |
| Several of the above | Pick the one that carries the main objective | Whether your department wants a single design |
A quasi-experiment applies a change but cannot randomly assign who gets it, for example comparing two existing classes. Causal claims are weaker than in a randomised experiment, and your report should say so. For a longer treatment of design labels and what each can support, read choosing a research design.
Variables and levels of measurement: the step students skip
A variable is anything that takes different values across people, organisations or time. In a quantitative project you name every variable and decide how it is measured. Then you classify each by its level of measurement, because that determines which summaries and tests are appropriate. The levels come from Stanley Stevens (1946) and run from lowest to highest as nominal, ordinal, interval and ratio, with higher levels carrying more precision; the University of Maryland nursing research module states that each variable's level determines the appropriate statistic, so you identify it first.
| Level | What it tells you | Typical example (fictional data) | Sensible summary |
|---|---|---|---|
| Nominal | Category only, no order | Faculty, gender, state of origin | Counts, percentages, mode |
| Ordinal | Categories with an order, gaps unknown | Satisfaction: low, medium, high | Median, frequencies |
| Interval | Equal gaps, no true zero | Temperature in degrees Celsius | Mean, standard deviation |
| Ratio | Equal gaps and a true zero | Income in naira, time in minutes, weight | Mean, ratios |
Two practical roles also matter:
- Independent variable: the thing you think influences something else, or the thing you manipulate in an experiment.
- Dependent variable: the outcome you measure.
A survey about social media use and study time might treat "hours on social media per day" (ratio) as the independent variable and "self-reported study hours" (ratio) as the dependent one, with "level of study" (ordinal) as a control. The moment you write this table, many vague objectives fix themselves.
The Likert scale argument
A single Likert item (strongly disagree to strongly agree) is ordinal. Many projects add several items into a total score and treat that as interval-like. That is a judgement call, and departments differ on whether they accept it, so state your treatment in the methodology and agree it with your supervisor. The detail is in which statistical test to use.
How your design drives sampling
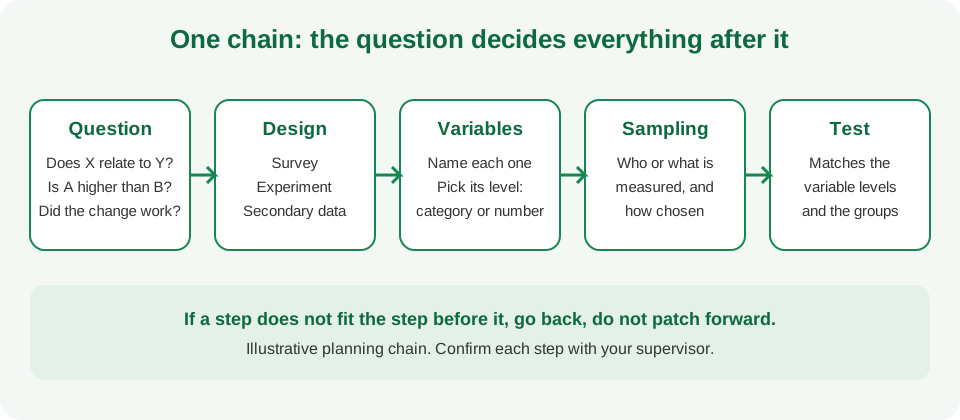
Sampling is not a separate decision. It follows from the design and the population you named.
- Survey: you need a population (for example, all 400-level students in one faculty), a way to reach it, and a selection method. Probability methods let you generalise more defensibly; convenience methods usually limit you to describing the people who answered. Sampling techniques walks through the options and how to justify them.
- Experiment: you need units (people, plots, samples) and a way to assign them to conditions. Fair assignment matters more than the headline number.
- Secondary data: your "sample" is the set of records you include, such as the firms listed in a period. State your inclusion and exclusion rules, because those are your sampling method.
How many respondents you need depends on the question, the analysis and what your department accepts, so do not copy a number from an old project. The reasoning is explained in how to calculate sample size; confirm the figure with your supervisor.
How your design drives the test
Once variables and groups are fixed, test selection becomes a short lookup instead of a guess.
| Your objective | Variables involved | Family of test to discuss with your supervisor |
|---|---|---|
| Describe a group | Any level | Frequencies, percentages, means |
| Compare two groups on a score | Group (nominal) and score (interval or ratio) | t-test or a rank-based alternative |
| Compare three or more groups | Group (nominal) and score | ANOVA or a rank-based alternative |
| Relate two categories | Two nominal or ordinal variables | Chi-square |
| Relate two measured variables | Two interval or ratio variables | Correlation, then perhaps regression |
| Measure change in the same people | Before and after scores | Paired comparison |
This is a map for conversation, not an automatic prescription; assumptions and sample size still matter, and which statistical test covers them step by step. If your result is a correlation table, reading a correlation table shows what the numbers do and do not say.
Measurement quality: validity and reliability
Numbers feel objective, but they are only as good as the instrument that produced them. Validity asks whether you measured the concept you claimed to measure. Reliability asks whether the measurement is consistent. A questionnaire can be neat, produce tidy tables and still measure the wrong thing. For the practical checks students can run, including how to document them, read validity and reliability of a questionnaire. A small trial run before the main collection also catches confusing items; see pilot study.
A worked example (fictional)
Imagine a student, Ada, in a business programme who wants to study "mobile payment use among students of her faculty". Here is how the chain works for her. All details are invented for illustration.
- Question: Is frequency of mobile payment use related to students' year of study?
- Design: A cross-sectional survey. She is not changing anything, so it is not an experiment, and no suitable existing dataset exists for her faculty.
- Variables: Frequency of use per week (ratio, a count); year of study (ordinal); gender (nominal).
- Population and sampling: Registered students in her faculty, reached through class representatives, with the limits of this approach stated honestly in the report.
- Planned analysis: Descriptive tables for all variables; a rank-based correlation between year and frequency, to be agreed with the supervisor.
- Claim she can make: An association among the students who responded, not a cause and not a national pattern.
Notice how step 6 is written before any data exists. If her supervisor wanted a statement about why students adopt mobile payments, the question would need to change, or a qualitative or mixed element would need to be added.
Common mistakes supervisors flag
- Choosing a test before the question. Copying "regression" because a past project used it, when your objective is only descriptive.
- Vague variables. "Performance" or "awareness" with no stated measure.
- Treating every Likert item as a ratio number without justification.
- Claiming cause from a survey. Correlation or association is the honest wording.
- Generalising from a convenience sample to all Nigerian students.
- Secondary data that does not match the concept, for example using a proxy without saying it is a proxy.
- Reporting only significance. Always say how large the difference or relationship is and what it means in context.
- Hypotheses that do not match the test. Write them together; see how to write hypotheses.
- Mixing tenses and layers in the methodology. What you did, what you planned and what you assumed should be clearly separate.
Questions your supervisor or panel may ask
- Why is this question better answered with numbers than with interviews?
- What is your population, and how did you choose who or what to include?
- What is the level of measurement of each variable?
- Why this test and not another? What assumptions did you check?
- How do you know your instrument measures what you say it measures?
- What can you not conclude from your results?
If you can answer these in two sentences each, your methodology chapter is probably coherent. For the writing side, how to write the methodology chapter shows how to lay it out.
A one-page checklist before you collect data
- Is the main objective answerable with numbers?
- Which route (survey, experiment, secondary data) carries it, and has your supervisor agreed?
- Is every variable named, defined and given a level of measurement?
- Are population and selection method written down, with limits stated?
- Is each objective paired with a hypothesis and an analysis you can justify?
- Is there an ethics or permission step if people are involved?
- Has the instrument been checked or piloted?
- Do you know what claim the design can and cannot support?
Where UniDraft fits
Once you have confirmed your design, variables, sample and results, UniDraft helps put them into your project document in the order your department expects, using your checked sources and your supervisor's instructions, in an editable Word file. You still run the analysis yourself or with your departmental statistician and verify every number. Start your project document with UniDraft. For formatting rules, see the formatting guide, and use the citations tool for the sources you have actually read.
Sources
- USC Libraries: Organizing Your Social Sciences Research Paper, Quantitative Methods (opened; used for the description of quantitative methods, survey, experimental and secondary-data approaches, strengths and limits)
- University of Maryland School of Nursing, NRSG 790 Module 3, Levels of Measurement (opened; used for the four levels, Stevens 1946, precision and the link between level and statistic)