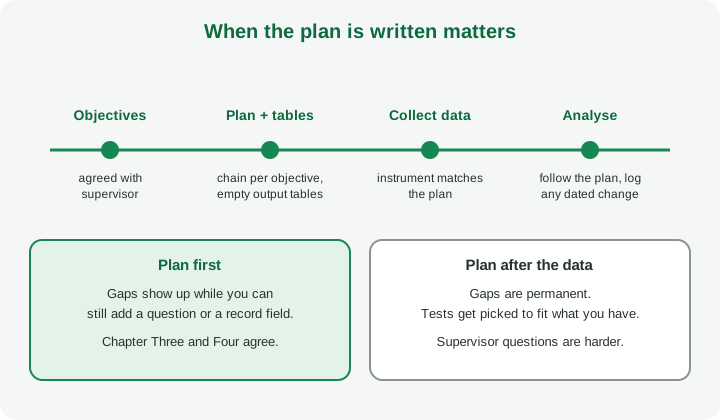
A data analysis plan is a short written plan, made before you collect any data, that links each research objective to a variable, the question or record that measures it, the analysis you will run and the empty table that will show the result. Writing it first shows gaps while you can still fix your instrument.
UniDraft organises your confirmed objectives, methods, checked sources and supervisor instructions into an editable Word document, so the plan you write here carries straight into Chapter Three. Start your project document when your objectives are settled. It does not run your analysis or produce results; that work stays yours.
What is a data analysis plan, and what is it not?
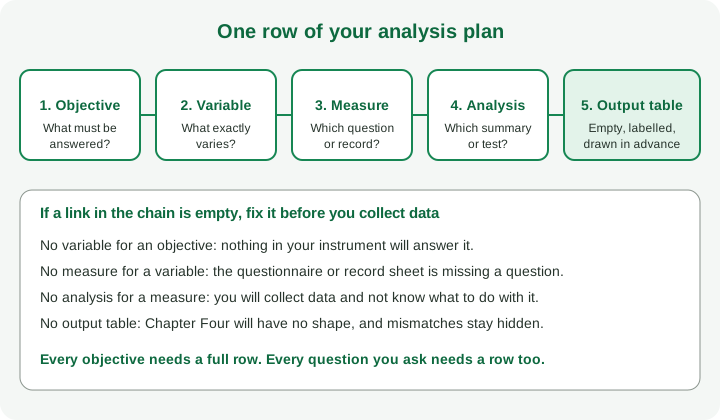
Definition: a data analysis plan is a map from what you want to know to what you will do with the data. Each row says which objective it serves, which variable it concerns, how that variable is measured, which analysis answers the objective and what output table the answer will appear in.
It is not three other things students confuse it with:
- Not the results. The plan contains no counts, percentages or p-values. If numbers appear in it before collection, something is wrong.
- Not a data collection plan. Collection says who, with which instrument, where and when. Analysis says what happens afterwards. The data collection methods guide covers the first; this post covers the second, and the two must agree.
- Not a data management plan. That one is about files, versions, access and handover, and the data management plan guide handles it.
The same idea appears in guidance far from student projects. A peer-reviewed template for statistical analysis plans recommends drafting the plan alongside the study protocol and completing it before the team looks at accumulating data. It also says analyses that were not specified in advance should be labelled post hoc or exploratory, with the reason for any departure recorded. That template is written for clinical studies, so its details do not transfer to your project, but the principle does: decide first, and be open about changes.
Why write the plan before you collect data?
Because every gap you find afterwards is permanent. A missing question cannot be asked again after your respondents have gone home. A variable you forgot to record cannot be reconstructed. And once you hold the data, the temptation is to pick whichever test gives an interesting-looking answer.
Three practical benefits:
- Your instrument gets better. When you must name the variable and the analysis for every objective, you discover which questions are missing and which are surplus.
- Chapter Three nearly writes itself. The analysis section is the plan, rewritten in the past tense to describe what you actually did.
- Your supervisor can help early. It is far easier to hear "this objective needs a different measure" in the proposal stage than at the results stage. If your department asks for a proposal, the proposal guide shows where this plan fits.
How do you build the plan, one row at a time?
Start from your objectives, not from the software. If your objectives are still vague, fix them first using the research questions and objectives guide; an analysis plan built on a vague objective is vague too.
Then, for each objective, fill these five links.
1. Objective
Copy the objective word for word. One row per objective. If an objective has two parts ("to describe X and compare Y"), split it into two rows, because the parts usually need different analyses.
2. Variable
Name each thing that varies and state what kind it is: categories with no order (such as faculty), ordered categories (such as a single agree-to-disagree item), or real measurements (such as minutes, marks or a scale total). The variable type narrows which analyses are even possible. The which statistical test guide walks through that narrowing, so this post does not repeat it.
3. Measure
Say exactly which questionnaire item, interview question, record field or system log captures the variable, and in what unit or response format. This is the link that most often turns out to be empty. If the measure is a multi-item scale, say how the items will be combined, and see the validity and reliability guide for why that needs support.
4. Analysis
Name the summary, comparison, relationship or interpretive method that answers the objective, and give a one-line reason it fits the variable type and the design. For a qualitative objective, name the approach you will follow instead of a test. Keep the choice proportionate: a descriptive objective answered with a clear frequency table is not made better by adding a test.
If you use statistics, also write down the software and the significance level, but take both from your department's guidance or your supervisor rather than from a blog post. Requirements differ between departments, so confirm them.
5. Output table
Draw the table or figure the result will appear in, with its title, row and column headings and units, and leave every result cell empty. This is the step that makes the plan checkable. If you cannot draw the table, you do not yet know what your analysis will produce.
Drawing the empty tables before the data arrive is also a way to test your own plan: if two objectives would produce the same table, one of them is probably not distinct.
What does a filled-in plan look like?
Fictional example, not collected data and not a recommended topic: a student plans a survey of undergraduates at an imaginary university about how they use campus mobile-banking apps. The four objectives below are invented for illustration. The student has not collected any data, so no results appear.
| Objective | Variable | Measure | Analysis | Planned output |
|---|---|---|---|---|
| 1. Describe how often students use a banking app | Frequency of use (ordered categories) | Questionnaire item 6, five fixed options | Frequency table with counts and percentages; missing answers shown separately, not counted as "never" | Table 4.1, empty: option, count, percent |
| 2. Compare satisfaction between hostel and off-campus students | Satisfaction score (constructed from items 10 to 14); residence (two categories) | Items 10 to 14 summed as defined in the instrument; item 2 for residence | Group summaries first; then a comparison suited to two independent groups, chosen with the supervisor after checking the score's distribution | Table 4.2, empty: group, number, summary, comparison result |
| 3. Examine whether time spent on the app relates to the satisfaction score | Weekly minutes on the app (measurement); satisfaction score | Item 7 in minutes; items 10 to 14 | Scatter plot, then a correlation or regression approach agreed with the supervisor | Figure 4.1 and Table 4.3, both empty |
| 4. Find out whether awareness of a security feature is linked to faculty | Awareness (yes/no); faculty (categories) | Items 15 and 3 | Cross-tabulation, with a test of association only if the table suits one | Table 4.4, empty: faculty by yes/no |
Notice what the table does. Objective 1 gets plain counts and no test. Objective 4 says "only if the table suits one," which is honest: whether a test is appropriate depends on what the data actually look like. Objective 3 names no single technique because the right one depends on the shape of the relationship, and the student has promised to check that with the supervisor. A plan can contain decisions that are deliberately conditional, as long as it says what the condition is.
Now the cross-check that makes the table useful: read down the "Measure" column and list the item numbers (6, 10 to 14, 2, 7, 15, 3). Every one must exist in the questionnaire. Then read the questionnaire and find any item that appears nowhere in the table. Either it has a purpose you forgot to write down, or it is a question you do not need. The questionnaire design guide covers building the instrument itself.
Which mismatches sink projects?
These are the problems supervisors and examiners tend to find when the plan was skipped. They are patterns, not statistics; no rate is claimed.
- An objective with no measure. The chapter promises to "assess the effect of X" but no question captures X.
- A measure with no objective. Twenty questionnaire items nobody analyses, which then appear as unexplained tables or are quietly dropped.
- A test that does not fit the variable. Averaging a single ordered item and then running a mean-based test without justification, or running a test of association on categories with very few cases in some cells.
- A comparison the design cannot support. Claiming one group "caused" a difference in another when the design was a one-time survey.
- Chapter Three and Chapter Four disagree. Chapter Three names a method that Chapter Four never uses, or Chapter Four uses one Chapter Three never mentioned.
- Hypotheses with no plan. A hypothesis was written, but nothing in the analysis tests it. The hypotheses guide shows how to word them so the test is obvious.
- A sample too small or too clustered for the planned analysis. The plan can reveal this early; for how many respondents you need, confirm with your supervisor, and see the sample size guide for the reasoning.
- Data cleaning decided after seeing the data. Deciding which responses to exclude once you can see which ones spoil the result is a bias. Write your cleaning rules into the plan.
What goes into Chapter Three from this plan?
The data analysis section of Chapter Three is the plan in finished form. Typically it states:
- The analysis approach for each objective, in the same order as the objectives.
- How the data were prepared: coding, checking, how missing answers and exclusions were handled.
- The technique or test used for each objective and why it fits the variable and design.
- The software, and any significance level your department expects.
- Any change from the original plan, with the date and the reason.
Your methodology chapter around it still needs the design, population, instruments and procedure; the methodology guide shows the full chapter. The coding and cleaning guide explains how to document the preparation step.
The output tables you drew in advance then become the skeleton of Chapter Four. Filling them is covered in the results chapter guide. If a filled table no longer looks like the planned one, that is not a failure; it is a change to record.
What if the plan changes after you start collecting?
It happens: a response rate is lower than hoped, a scale turns out unreliable, a supervisor suggests a better approach. Handle it in the open:
- Write a short dated change note: what changed, when, and the reason.
- Update Chapter Three so it describes what you actually did.
- Label any analysis added after you saw the data as exploratory.
- Never present a later choice as if it were planned from the start.
That honesty is not a weakness. Examiners generally respond better to a documented, reasoned change than to a plan that appears perfect and does not match the tables.
A checklist before you collect
Use this with your supervisor.
- Does every objective have its own row, copied word for word?
- Is every variable named, with its type?
- Does every variable have a specific item, question or record field?
- Does every item in your instrument appear in a row, or have a stated reason to exist?
- Is the analysis for each objective named, with a one-line reason?
- Are analyses that depend on what the data look like marked as conditional?
- Is each output table drawn and left empty?
- Are cleaning and missing-data rules written down before you see the data?
- Have you confirmed software and any significance level with your department?
- Have you asked your supervisor to read the plan, not only the proposal?
Questions to expect from your supervisor
- "Which question in your questionnaire answers objective three?"
- "Why this analysis and not a simpler summary?"
- "What will you do if the data do not meet that analysis's assumptions?"
- "How did you decide who or what to exclude?"
- "Show me the table where this result will appear."
If you can answer these from the plan, you are ready. If you cannot, the plan has found the problem early, which is its job.
Where UniDraft fits in
Once your objectives, methods and, later, results are confirmed, UniDraft helps organise them with your checked sources and supervisor instructions into an editable project document. Start your project document. Use the free citations tool for your references as you go. The analysis, the interpretation and every number stay yours.
Sources
- A template for the authoring of statistical analysis plans, opened for the principle of drafting the plan with the protocol and labelling unplanned analyses.
- Preparing to analyse quantitative data, University of York Maths Skills Centre, opened for the idea of a data analysis plan as a working guide.