
An Economics project topic works when it names defined measures, a place and a period, and when you have confirmed the data exist for all three. Decide early whether your evidence is a published time series (CBN, NBS, World Bank) or your own survey, because each route has different checks, risks and software needs.
UniDraft's free topic generator can build a starting shortlist from your department and interests. Treat each suggestion as a rough idea, then test it with the data checks below before taking it to your supervisor.
Once the question and evidence are settled, the work becomes a document you must explain from source to conclusion. UniDraft helps organise your confirmed Economics question, your own results, checked sources and your supervisor's instructions into an editable Word project. Start your Economics project document, bringing the analysis and data records yourself and reviewing every figure and claim.
Which route fits your question?
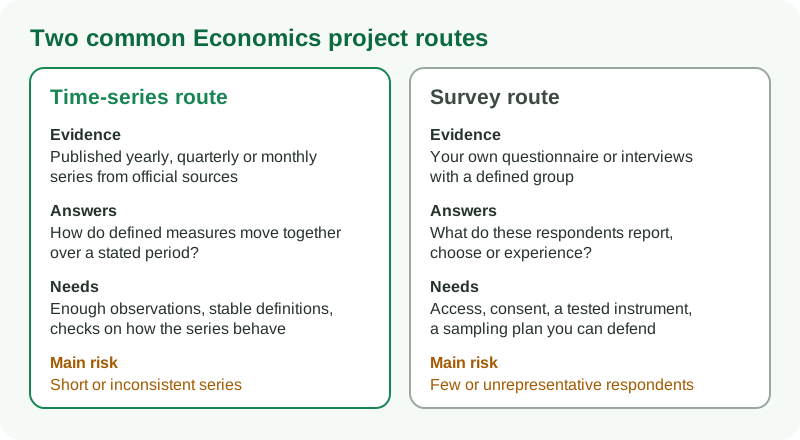
Most undergraduate Economics projects take one of two routes. A third, a literature-based design, may be acceptable in some departments; follow your own brief.
| Question shape | Usual route | What you must be able to show |
|---|---|---|
| How do two defined national measures move together over a period? | Time series | Series with stable definitions and enough observations |
| Do households, traders or students in a defined group report a behaviour? | Survey | Access, consent, a tested questionnaire and a sampling plan |
| What does existing research say about a mechanism? | Literature-based | A search record and a clear selection rule |
| Did a particular policy coincide with a change? | Time series with care | A defensible date, comparable measures and honest limits |
The route is not a matter of taste. It decides your method, your chapter three and the questions you will face at the defence. The research-design guide explains how question and design must match, and the primary and secondary data guide covers what each kind of evidence can and cannot support.
Here are two provisional question shapes, not approved titles or completed studies. A time-series shape: how are a named exchange-rate measure and a named price measure related over a stated period? A survey shape: how do traders in one named market describe their response to price changes? Neither is ready until the data, access and your brief are checked.
What makes an Economics topic different from other project topics?
In many departments the project is expected to link a question to economic theory and to evidence about Nigeria or a Nigerian sector. That is why so many Economics projects start with a macro variable such as inflation, exchange rates, money supply, government spending or growth. It is also why so many of them look alike.
A repeated topic is not forbidden. It is a risk: your supervisor and examiners may have read similar work. What helps is a sharper question, a period or sector you can justify, and honest limits. If you want to see where existing work leaves room, the research-gap guide shows a practical way to find it, and how to find research papers covers where to look.
Keep this page separate from the seminar side. A seminar usually asks you to explain and discuss existing evidence; a project usually asks you to carry out an investigation. If your task is a seminar, use the Economics seminar guide instead of relabelling discussion as a completed study.
Where do Nigerian macroeconomic data come from?
You will meet the same three or four sources again and again. Treat them as starting points to open and read, not as a promise that your exact series exists.
Central Bank of Nigeria (CBN). The CBN's statistics and rates pages list items such as exchange rates, money and credit statistics, inflation rates, GDP, foreign reserves, government securities, surveys and the annual and quarterly statistical bulletins, and they point to a separate statistics database. The page itself does not show dates or the latest period for each series, so open each one and record what it actually covers. Do not assume a long continuous history exists because a heading does.
National Bureau of Statistics (NBS). NBS publishes price, national accounts, labour and trade releases. Its consumer price index has been rebased, with a new base year and weight reference period described in its documentation, so older and newer index values need care. For any NBS series, read the methodology note for the release you use and cite the release, not just the website.
World Bank open data. The World Bank's data catalogue states that its default licence is Creative Commons Attribution 4.0, which means you must give appropriate credit and indicate any changes (World Bank public licences). Its country indicator pages are convenient for longer annual series and cross-country comparison. Annual data can lag, and some indicators are estimates or modelled, so read the series notes.
IMF data. The IMF also publishes country statistics through its data portal. Terms and the way older series are organised have changed over time, so read the current terms on the portal before you rely on or republish anything. This guide has not checked the portal's current terms for you, so look them up yourself.
How current is each source? That changes constantly, so a fixed answer here would go stale. Open the series, find the latest observation, and write down the date you retrieved it. If two sources give different values for the same period, do not quietly pick the one that suits your argument: record the difference, find out why (definition, revision, base year) and discuss it with your supervisor.
How do I know a series is usable?
A downloaded spreadsheet is not yet an observation. Build a series register for every variable:
| Item | What to record |
|---|---|
| Exact name | The wording used by the source, not your shorthand |
| Source and release | Publication, table, version and date retrieved |
| Definition | What it measures, and what it leaves out |
| Unit and base | Naira or dollars, current or constant prices, base year |
| Frequency | Annual, quarterly or monthly |
| First and last period | What the source really covers |
| Known breaks | Rebasing, method changes, revisions |
| Gaps | Missing periods and the stated reason |
Missing, not applicable and not published are different from zero. Never fill a gap with a guess. If a series has a break, such as a rebased index, discuss with your supervisor whether to use one consistent segment, convert carefully using documented rules, or change the question. For general data hygiene, the data management plan guide covers keeping raw files, versions and notes together.
What about stationarity and data length?
You will probably hear the word stationarity early in a time-series project. At a plain level, a series is stationary when its basic behaviour (its average level and spread) does not drift over time. Many macro series trend upwards, such as price levels or GDP in naira. Two trending series can look strongly related simply because both drift, even when there is no real connection. This is the classic spurious regression problem described in the econometrics literature.
That is why supervisors ask about unit root tests and, for related series, cointegration. You do not need to master the theory to avoid the worst mistakes, but you do need to be able to say what you did and why.
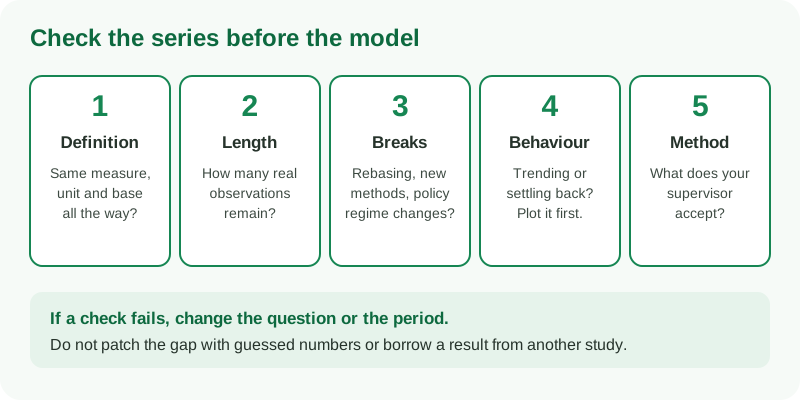
A plain-language set of habits:
- Plot the series first. Look for trends, jumps and sudden changes before running anything.
- Count real observations. Taking differences or adding lags uses up observations. Twenty annual points can shrink quickly.
- Remember tests have limits. Unit root tests can have weak power in short samples, so a single test result is a weak basis for a confident claim. Report the test you used, the lags you chose and the limits honestly.
- Do not copy a method because a past project used it. Your data and period may not suit it.
- Describe what you found without causal overreach. A relationship in the data is not automatically proof that one variable caused the other.
How many years are enough? There is no universal number, and none is invented here. Methods differ, and your supervisor or department may have expectations. A sensible habit is to ask: after differencing and lags, how many observations remain, and can I justify the method with that many? If not, consider quarterly data where it exists for your variables, a narrower question, or a different route.
The methodology chapter guide shows how to describe your data, model and checks clearly, and the statistical test guide helps you match a test to the question and data type.
Fictional example: a long title with one downloaded file
This is an invented planning exercise. No data have been assembled, no model run and no findings are supplied.
A student proposes "The effect of government spending on economic growth in Nigeria, 1990 to 2024." They have downloaded one annual file with a column for each.
| Decision | Status in the fictional exercise | Next step |
|---|---|---|
| Spending measure | Unclear which spending (total, capital, recurrent) | Choose the definition and find its source table |
| Growth measure | "Growth" could mean level, rate or per-person change | Choose one and justify it |
| Coverage | One file seen; full period unverified | List the sources needed for each year |
| Breaks | Not checked | Look for rebasing or definition changes |
| Observations | Roughly thirty-five annual points, before lags | Count what remains after any differencing |
| Wording | "Effect" suggests a causal claim | Reword to what the design can support |
| Decision | Candidate only | Discuss with supervisor and revise |
The next step is a feasibility note, not a regression. A more modest provisional question might ask about the association between two defined measures over a verified period. That might still fail the checks, and that is a useful outcome: you learn it before you have written three chapters.
If a student cannot verify a series for part of a period, narrowing the dates honestly is better than splicing in unexplained numbers. Your examiners will ask where each figure came from.
What if I choose a survey route instead?
A survey suits questions about people: spending choices, perceptions, adoption of a service or responses to price changes in a defined group. The data are yours, but so are the problems.
- Access and permission. Can you reach the group and, where needed, obtain permission? The ethics and consent guide covers the basics.
- Instrument. A questionnaire that was never tested produces unreliable answers. See the questionnaire design guide and the validity and reliability guide.
- Sampling. Say who is in your population, how you chose respondents and why that choice fits your claim. The sampling guide and sample size guide help here.
- Honest claims. Answers from one market, campus or town do not describe Nigeria. Say what your group is.
A survey also needs analysis, and a small or unrepresentative sample limits what you can conclude. Do not invent respondents or inflate numbers. If the response is thin, report it and discuss the limitation.
Which software should I use?
Ask your department and supervisor first. Many Economics departments teach or expect a particular package, and that is the safest default. Commonly used options include EViews, Stata, SPSS and Excel, and free tools such as R and gretl exist too. Which one is available to you depends on your institution, your laptop and your licence situation.
Whatever you choose, three rules hold:
- You run the analysis and you understand the output. Be ready to explain each table at the defence.
- Keep a record. Save the data file, the steps and the settings (such as the lag length) so you can reproduce your results.
- Report what the software did. Name the package, the version if you know it, and the tests you ran.
UniDraft does not run your analysis, estimate models or interpret your output. It helps organise the confirmed results, your checked sources and your supervisor's instructions into an editable document, so the writing reflects what you actually did.
Questions to expect from your supervisor
- Which exact series will you use, and where does each come from?
- Do the definitions stay the same across the whole period?
- How many observations will remain after you prepare the data?
- Why this method for this data, and what are its limits?
- What can your results say, and what can they not say?
- If you chose the survey route: who are your respondents and why do they fit?
Practise answering these from your series register and notes. The same questions often return at the defence; see common project defence questions.
Common mistakes
- Choosing a title first and hunting for data afterwards.
- Treating a downloaded column as a verified observation.
- Mixing old and rebased index values without checking comparability.
- Using "effect" or "impact" when the design shows only association.
- Running a model because a past project did, without checking your own data.
- Copying output without being able to explain it.
- Ignoring the department's required format and brief.
For a related topic page in another discipline, the Accounting project topics guide shows the same evidence-first approach, and the general project-topic guide helps you test scope and access before you commit.
Take a decision note to your supervisor
Bring your provisional question, the route you propose, your series register or survey plan, a count of usable observations or respondents, and the gaps you have found. Say which claim your evidence could support and which it could not. Your supervisor's decision outranks anything written on a general blog.
When the question and method are agreed, prepare your project with UniDraft from your confirmed work and instructions, then check every source, figure and interpretation yourself. The software prepares documentation; it does not supply data, run your analysis or guarantee approval. You can also use the formatting tools to check layout once your content is ready, and the citation helper for references.
Sources
- Central Bank of Nigeria: statistics and rates, opened to confirm the categories of series listed. No figures are reproduced here.
- World Bank Data Catalog: public licences, opened to confirm the default CC BY 4.0 licence and attribution requirement.