
A t-test compares the means of two groups on a score or measurement: use the independent version for two separate groups and the paired version for the same people measured twice. One-way ANOVA does the same job for three or more independent groups. Check the assumptions first, then report the statistic, degrees of freedom, p-value and the size of the difference.
Once you have run the test in your own software, your project still needs the method and results written up in your department's format. UniDraft organises your confirmed objectives, checked sources and supervisor instructions into an editable Word document. Start your project document when you are ready, and keep every number in it tied to your real output. If you are still choosing between tests overall, start with which statistical test fits your project.
What is the difference between a t-test and ANOVA?
Both ask whether group means differ by more than chance would explain. The difference is how many groups you have.
| Situation | Test | Example (fictional) |
|---|---|---|
| Two different groups | Independent-samples t-test | Practical scores of two separate classes |
| Same people, two measurements | Paired-samples t-test | Test scores before and after a training week |
| Three or more different groups | One-way ANOVA | Scores of 100-, 200- and 300-level students |
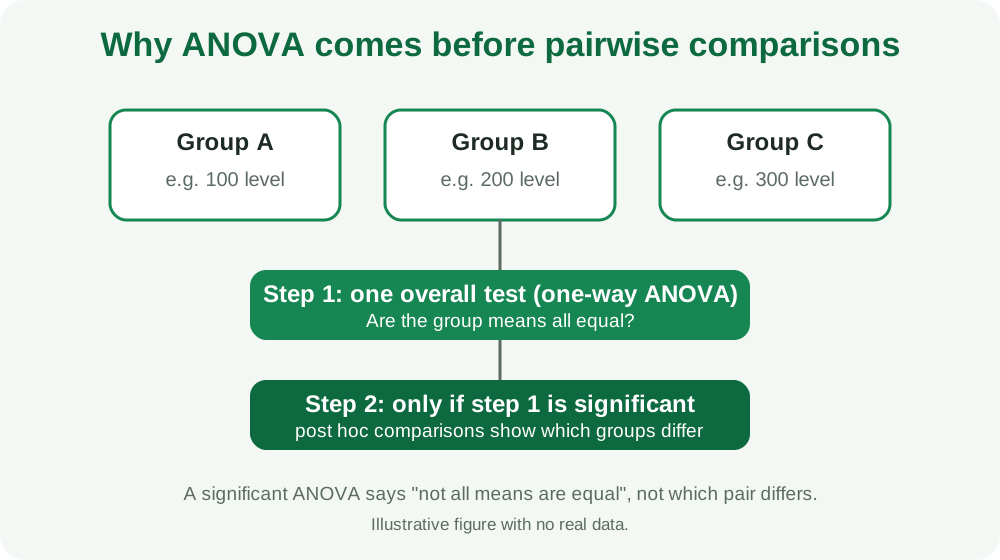
The reason ANOVA exists is simple. With three groups you could run three t-tests (A vs B, A vs C, B vs C), but each extra test is another chance of a false alarm. One-way ANOVA tests whether the population means across the levels of a single factor are all equal, in one overall test. NIST's Engineering Statistics Handbook states the null hypothesis exactly this way: there is no difference in those means.
This guide covers the mean-comparison family only. A relationship between two measurements (correlation) and two categorical variables (chi-square) are different questions; the overall test chooser places all of them side by side.
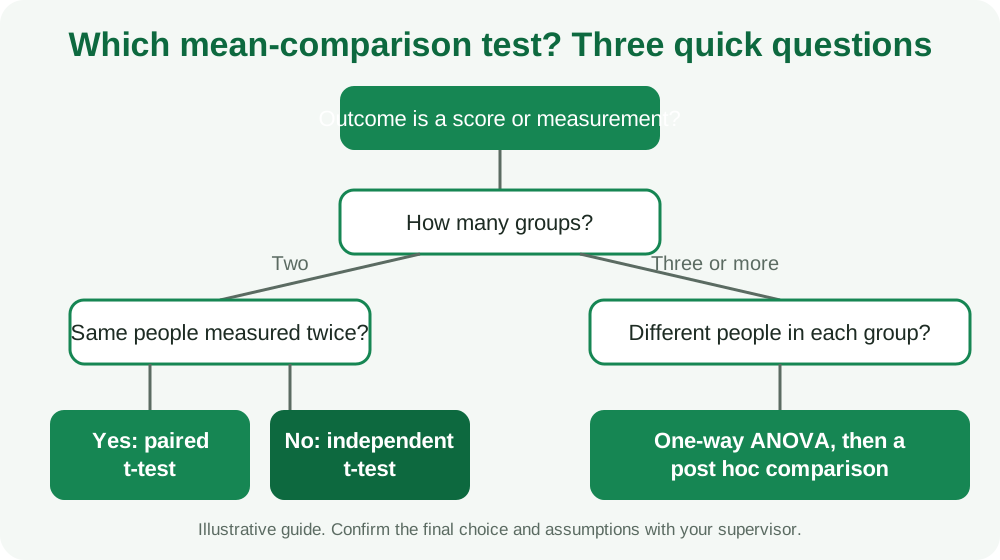
Which one fits my objective?
Work backward from the objective, not forward from a favourite test. Write the comparison as a sentence first:
- "Compare mean exam scores of students taught by method X and method Y." Two groups, different people. Independent t-test is the candidate.
- "Determine whether scores changed after the training." One group, two time points. Paired t-test is the candidate.
- "Compare mean satisfaction scores across four faculties." Four groups. One-way ANOVA is the candidate.
If you cannot write the sentence, the test is not the problem; the objective is. Tighten your research questions and objectives and word your hypotheses so each names the variables and the comparison. The wording usually reveals the test.
A caution about "different people". Two classes taught by different lecturers are two groups, but students inside one class are not fully independent of each other, and the class itself can differ in ways that have nothing to do with your variable. Mention this honestly in your limitations and ask your supervisor how to treat it.
The independent-samples t-test
Use it to compare the means of two separate groups on one score. Typical student cases: male vs female students on a score, users vs non-users of a service, treatment vs control group.
Plain-language assumptions, drawn from Kent State University's SPSS guidance:
- The outcome is a measurement (interval or ratio), such as marks, minutes or a validated scale total.
- There are exactly two groups, defined by a categorical variable.
- The groups are independent. Nobody appears in both, and one group does not influence the other. The guide warns that breaking this gives an inaccurate p-value.
- The data come from a random sample of the population you describe. If yours is a convenience sample, say so and do not claim the result applies to everyone.
- The outcome is roughly normal within each group. Strong skew or heavy tails reduce power, though the guide notes that moderate or large samples may still give accurate p-values.
- The groups have similar spread (variances). If they do not and group sizes differ, the standard p-value is unreliable.
- No outliers distorting the picture.
Kent State's guide explains the practical handling of point 6: software usually prints Levene's test for equal variances next to the t-test. A small Levene p-value suggests the variances differ, so you read the "equal variances not assumed" (Welch) row; a large one lets you read the "equal variances assumed" row. Say in your write-up which row you used.
The paired-samples t-test
Use it when the same people are measured twice (before and after) or when each person in one group is deliberately matched with one in the other. The test asks whether the mean difference between pairs is zero.
Assumptions from the same Kent State source:
- The outcome is a measurement, recorded once per condition.
- The same subjects appear in both conditions, or the pairs are properly matched.
- The data come from a random sample.
- The differences between the paired values are roughly normal. Check the difference column, not the two original columns.
- No outliers in the differences.
Two practical points. First, each student needs a usable score at both times; a student who dropped out of the post-test cannot form a pair, and you should say how many pairs remained. Second, using an independent t-test on paired data throws away the link between the two measurements, so choose by the design, not by what is easier to enter in the software.
A before-and-after change does not by itself show that the training caused it. Other things changed during that week too. The experimental design guide explains what a control group adds.
One-way ANOVA
Use it to compare the means of three or more independent groups on one score. Kent State lists these assumptions: a continuous outcome, a categorical grouping variable with two or more groups, independent groups, a random sample, an outcome that is roughly normal in each group, similar variances across groups, and no outliers. NIST's handbook states the normality assumption on the sampled populations in the same way.
The most important thing to understand is what a significant result means. Kent State is explicit: the F test is an omnibus test. It indicates that at least one group mean differs from the others, but it "does not indicate which mean is different". For that you need follow-up comparisons.
What is a post hoc test, and when do I need one?
A post hoc test compares specific pairs of groups after a significant ANOVA, while controlling for the fact that you are making several comparisons at once. If the overall ANOVA is not significant, you generally stop; hunting through pairs afterwards is the same trap as running many t-tests.
Statistics software offers several post hoc options. Kent State notes that when variances are unequal, post hoc tests that assume equal variances may not be trustworthy, and it points to alternatives built for that case (Dunnett's C is named for unequal variances), and to Dunnett's test when every group is compared with a single control. No single rule fits every department, so ask your supervisor which post hoc procedure the department expects, name it in Chapter 3, and report the pairwise results it gives.
Assumptions in plain language
Students often treat the assumptions as a ritual. They are really three questions:
| Question | What to look at | What to do if it looks wrong |
|---|---|---|
| Is the outcome roughly bell-shaped within each group? | Histogram or Q-Q plot per group; sample size | Discuss with your supervisor; a rank-based alternative or a different approach may be suitable |
| Do the groups have similar spread? | Standard deviations, Levene's test | Use the unequal-variance (Welch) version if your software provides it |
| Are observations independent? | How you collected the data | This is a design problem; no test fixes it. State it as a limitation |
Independence is the assumption software cannot check for you. If respondents filled the questionnaire in a group, copied each other, or one person was entered twice, the p-values cannot be trusted. Read your sampling approach again with that in mind, and check your sample size rather than assuming that more rows always rescue a weak design.
Another check happens before any test: that the data are clean. A mistyped 85 entered as 850 will wreck a mean. See coding and cleaning questionnaire data before you run anything.
Can I use a t-test on Likert scale data?
A single Likert item is ordinal, and treating it as a precise measurement needs justification. Many projects add several items into a total or mean score and treat that as approximately interval. If you do, say how the score was built and why that is defensible, and check your department's guidance. The Likert analysis guide walks through the reasoning, and it is worth reading before you promise a t-test in Chapter 3.
How do I report t-test and ANOVA results?
Report enough that a reader can check your reasoning: the groups, descriptive statistics, the test statistic with degrees of freedom, the p-value, and the size and direction of the difference. Kent State's reporting guidance for the independent t-test lists the statistic with its degrees of freedom, the p-value, the decision at your chosen significance level, which group had the higher mean, the confidence interval for the difference, and an effect size such as Cohen's d. The same kinds of items apply to the other tests.
Below are fictional reporting sentences with placeholders. The square brackets stand for numbers you must take from your own output. Do not copy a sentence and fill it with guessed values.
Independent t-test (fictional design): "An independent-samples t-test compared practical-exam scores of students taught with lab simulation (M = [mean], SD = [sd], n = [n]) and students taught by demonstration (M = [mean], SD = [sd], n = [n]). The difference was [statistically significant / not statistically significant], t([df]) = [t], p = [p], with the simulation group scoring [higher / lower] by [difference] marks (95% CI [lower] to [upper])."
Paired t-test (fictional design): "A paired-samples t-test compared the same [n] students' scores before and after the four-week training. Mean scores were [mean] before (SD = [sd]) and [mean] after (SD = [sd]); the mean difference of [difference] was [significant / not significant], t([df]) = [t], p = [p]."
One-way ANOVA with follow-up (fictional design): "A one-way ANOVA compared satisfaction scores across 100-, 200- and 300-level students. The overall test was [significant / not significant], F([df between], [df within]) = [F], p = [p]. [If significant:] Post hoc comparisons using [the procedure named in Chapter 3] showed that [pair] differed ([difference], p = [p]) while [pair] did not."
Non-significant result (fictional design): "No statistically significant difference was found between the two groups, t([df]) = [t], p = [p]. This means the study did not detect a difference at the chosen level. It does not show that the groups are identical, and the sample size of [n] limits what can be concluded."
Notice what the sentences avoid. They do not say "proved", they say how many people were in each group, and the non-significant version is written as a real result rather than an embarrassment. Put the descriptive statistics in a table and keep software screenshots out of the main text; the Chapter 4 guide shows how to present them. If you prefer the report in APA style, confirm with your supervisor which reporting style your department requires, since conventions for decimals, italics and effect sizes differ.
Statistical significance versus a meaningful difference
"Significant" is a statement about how surprising the data would be if there were truly no difference. It is not a statement about size or importance. With a large sample, a tiny difference in marks can be significant; with a small sample, a large difference can fail to be. That is why the confidence interval and an effect size, where your method allows one, belong in the report. Discuss the practical meaning in Chapter 5 and be honest about limits.
Common mistakes supervisors flag
- Several t-tests instead of one ANOVA for three or more groups.
- Independent t-test on paired data, or the reverse.
- Reading the ANOVA as "all groups differ" when it only says the means are not all equal.
- Running post hoc tests after a non-significant ANOVA.
- Ignoring Levene's test or not stating which row of the output was used.
- Reporting only the p-value, with no means, standard deviations, n or direction.
- Calling a convenience sample random because the software produced a p-value.
- Changing the test after seeing the results without saying so.
- Claiming causation from a before-and-after change with no control.
Defence questions to prepare for
Examiners rarely ask you to compute a t-statistic by hand. They ask whether you understand your choice. Prepare short answers to these:
- Why a t-test (or ANOVA) rather than another test?
- How did you check the assumptions, and what did you find?
- Were the groups independent? How do you know?
- What does a p-value of [your value] mean in plain words?
- Why did you run, or not run, a post hoc test?
- What is the size of the difference, and does it matter in practice?
- What are the limits of your sample?
The defence questions guide covers the wider panel conversation.
Checklist before you write Chapter 4
- Each comparison is written as a sentence naming the groups and the score.
- You know whether the groups are independent or paired.
- You checked normality, spread and outliers, and recorded what you found.
- The test, software, significance level and post hoc procedure are stated in Chapter 3, and your methodology chapter matches what you actually did.
- Every number comes from your real output, with n stated for each group.
- Your supervisor or a departmental statistician has seen the plan.
Where UniDraft fits in
UniDraft does not run your t-test or ANOVA. You analyse the data in your own software and confirm the output. UniDraft then helps organise your confirmed work, checked sources and supervisor instructions into an editable Word document. Use the free citation tool for your references, then start your project document.
For two categorical variables, use the chi-square test guide instead.
Sources
Opened and read while preparing this page:
- NIST Engineering Statistics Handbook: One-way ANOVA: what one-way ANOVA tests and its normality assumption.
- Kent State University Libraries: Independent samples t test: assumptions, Levene's test and reporting guidance.
- Kent State University Libraries: Paired samples t test: what it compares and its assumptions, including normal differences.
- Kent State University Libraries: One-way ANOVA: assumptions, omnibus F test and post hoc options.