
Regression analysis estimates how much an outcome (the dependent variable) changes when one or more predictors (independent variables) change. Simple regression uses one predictor, multiple regression uses two or more. For a project, you read the model's R-squared, each coefficient and its p-value, then report them without claiming more than your data and design allow.
Once your output is checked, UniDraft helps you organise your confirmed methods, verified results and supervisor instructions into an editable final-year project document. Start your project document and keep the original software output beside the draft so every number can be traced. Run the regression itself in your statistics software; UniDraft does not run your analysis or supply results.
When is regression the right tool?
Use regression when your objective is about explaining or predicting a numerical outcome from other variables, not just comparing two groups. Typical project questions sound like "How far do study hours and attendance predict course scores?" or "What is the effect of inflation and exchange rate on share price?" The word "effect" in a topic often hints at regression, but check what the study design lets you claim.
Compare it with the tests you may have met already. A t-test or ANOVA asks whether group means differ; correlation asks whether two variables move together; regression goes further and gives an equation. If you are still choosing, the guide to picking a statistical test walks through the decision, and the t-test and ANOVA guide covers the group-comparison side.
Two practical conditions before you start:
- The outcome is numerical. Ordinary (linear) regression assumes a numerical dependent variable such as a score, an amount in naira or a count of units. If your outcome is yes/no, a different kind of regression is needed, and you should discuss that with your supervisor.
- Your objectives and hypotheses name the variables. If you cannot say which variable is the outcome and which are predictors, settle that before opening the software. The guide to writing hypotheses helps.
What is simple regression?
Simple regression fits a straight line through your data points using one predictor. The line is written as:
Y = a + bX
- Y is the outcome (for example, course score).
- X is the predictor (for example, weekly study hours).
- a is the intercept: the predicted Y when X is zero.
- b is the slope: the expected change in Y for each one-unit increase in X.
The software chooses the line that makes the gaps between the points and the line, called residuals, as small as possible overall. Each gap is the part of that case the line does not explain.
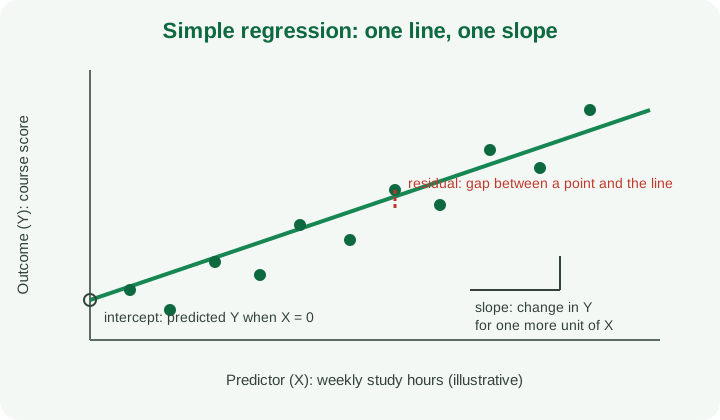
A slope only makes sense with its units. A slope of 1.85 on "weekly study hours" predicting "course score out of 100" means that, in this sample, each extra weekly hour goes with about 1.85 more score points. The intercept is often not meaningful by itself, because X equal to zero may sit outside your data (nobody studies zero hours and also attends every class, say). Do not build a paragraph of interpretation around an intercept unless zero is a realistic value.
What is multiple regression?
Multiple regression uses two or more predictors in one model: Y = a + b1X1 + b2X2 + b3X3. The key reading rule is that each coefficient is the expected change in the outcome for a one-unit increase in that predictor with the other predictors held fixed. That phrase must appear, in some form, in your interpretation.
It matters because predictors often overlap. Students who study longer may also attend more. In a simple regression on study hours alone, the slope soaks up some of the effect of attendance. In the multiple model, the study-hours slope is what remains after attendance is accounted for, so it can shrink, grow or even change sign. When predictors are strongly correlated with each other, individual coefficients become hard to interpret, and the estimates can be unstable.
Multiple regression is common in business, economics, education and health projects because real outcomes rarely depend on one thing. But more predictors is not automatically better; see the mistakes section below.
What assumptions should I know about?
Regression results are only trustworthy if the data roughly behave the way the method expects. Sources that teach multiple linear regression usually list these five, in plain terms (the NIST handbook treats residual plots as the main way to check them):
| Assumption | Plain meaning | Common way to check |
|---|---|---|
| Linear relationship | Each predictor relates to the outcome along a roughly straight line | Scatter plot of each predictor against the outcome |
| Independence | Cases do not influence each other (no repeated measures on the same person treated as separate people) | Look at how data were collected; some software offers a Durbin-Watson check for the residuals |
| Constant spread of residuals (homoscedasticity) | Errors are about equally spread across the predicted values | Plot residuals against predicted values; a widening cone suggests a problem |
| Roughly normal residuals | The leftover errors are bell-shaped, not the raw variables | Q-Q plot of residuals, sometimes a formal test |
| No serious multicollinearity | Predictors are not almost copies of each other | Variance inflation factor (VIF); values above about 5 or 10, depending on the field, are commonly treated as warning signs |
Two cautions. First, the normality assumption concerns the residuals, not each variable on its own, so a skewed predictor is not automatically a failure. Second, formal tests for normality can flag small departures when samples are large, which is why many guides pair them with plots. How strict your department is about each check varies, so ask your supervisor which diagnostics must appear in the write-up.
Note also what these checks cannot fix: if your sample was not collected sensibly, or your questionnaire items are weak, no diagnostic rescues it. Review your sampling approach and, for survey scales, the validity and reliability checks.
What do I do before I run the model?
Do the groundwork first; it prevents most output you cannot explain.
- Clean the data. Fix coding errors, check missing values and reverse-coded items. The data coding and cleaning guide lists the usual traps.
- Describe every variable. Look at means, spread and outliers. Odd values show up here before they distort the model. See descriptive statistics for your project.
- Look at the correlations. A correlation table between predictors flags overlap early. The correlation table guide shows how to read one.
- Decide the model on your objectives, not on whichever combination looks best afterwards.
- Plot the residuals after fitting, and look at the plots before the p-values.
How do I read a regression output table?
The layout differs between SPSS, Excel, Stata, R and others, but the content falls into the same three blocks. Read them in order.
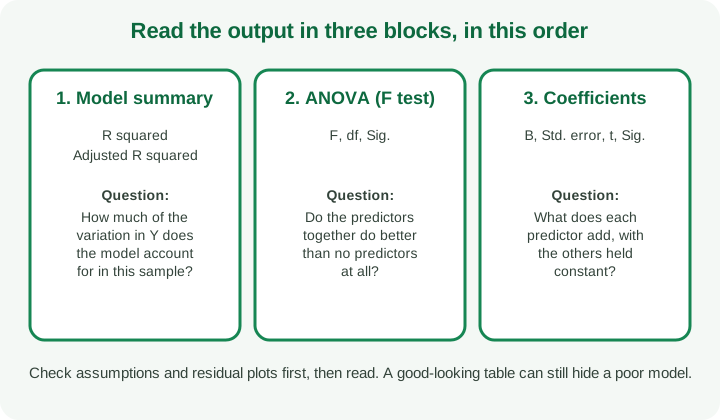
The numbers below are fictional placeholders for a made-up study of 120 students with course score (out of 100) as the outcome. They are invented to show the layout and are internally consistent (each t equals B divided by its standard error). They are not real findings, and you must never copy them into your own report.
Block 1: Model summary
| R | R-squared | Adjusted R-squared | n |
|---|---|---|---|
| 0.62 | 0.38 | 0.36 | 120 |
Block 2: ANOVA (overall F test)
| F | df (model, residual) | Sig. |
|---|---|---|
| 23.70 | 3, 116 | < .001 |
Block 3: Coefficients
| Predictor | B | Std. error | t | Sig. (p) |
|---|---|---|---|---|
| (Constant) | 8.20 | 3.10 | 2.65 | .009 |
| Weekly study hours | 1.85 | 0.40 | 4.63 | < .001 |
| Attendance (%) | 0.31 | 0.15 | 2.07 | .041 |
| Weekly social media hours | -0.30 | 0.72 | -0.42 | .678 |
What does R-squared mean here?
R-squared is the proportion of variation in the outcome that the model's predictors account for in your sample. In the fictional table, 0.38 means the three predictors together account for about 38% of the variation in scores, and the other 62% is left to things not in the model. It does not mean the model is "38% accurate".
R-squared never falls when you add a predictor, even a useless one, because the fit can always set the new coefficient to zero. That is why adjusted R-squared exists: it adjusts for the number of predictors and the sample size, and it only rises when a new variable improves the fit more than chance would. Report both, and use the adjusted figure when comparing models with different numbers of predictors. Also remember that a high R-squared does not show the model is correctly specified or that the predictors cause the outcome.
What counts as a "good" R-squared depends on the field and the outcome. Do not quote a cut-off from a blog; look at what comparable studies in your area report and ask your supervisor.
What does the F test tell me?
The ANOVA block asks whether the predictors together fit better than a model with no predictors. A small Sig. value supports saying the model as a whole is statistically significant. It does not say which predictors matter; for that, move to the coefficients.
How do I read the coefficients and p-values?
- B is the unstandardised coefficient: the expected change in the outcome per one-unit increase in the predictor, others fixed. Here, each extra weekly study hour goes with about 1.85 more points.
- Std. error shows how precisely B is estimated.
- t is B divided by its standard error.
- Sig. (p) is the probability, assuming that predictor has no relationship with the outcome in the population, of getting a t this large or larger. A small p gives evidence against "no relationship"; it is not the chance that your hypothesis is true.
Apply a pre-set significance level, usually one your department or methodology chapter has named, to decide whether to call a coefficient statistically significant. In the placeholder table, study hours and attendance would count at a .05 level, social media hours would not. "Not significant" means the data did not show clear evidence of a relationship once the other predictors were in the model, not proof that none exists.
If your software also prints standardised (Beta) coefficients, they put predictors on a comparable scale, which helps when you want to say which predictor is relatively stronger. Confidence intervals for B, if available, show the plausible range and are more informative than a p-value alone.
How do I write the results?
State the model, the fit, and each predictor's contribution in words, with the numbers from your own verified output. A pattern using the fictional values above:
A multiple linear regression was conducted to examine whether weekly study hours, attendance and weekly social media hours predict course score. The model was statistically significant, F(3, 116) = 23.70, p < .001, and accounted for 38% of the variance in scores (adjusted R² = .36). Weekly study hours (B = 1.85, p < .001) and attendance (B = 0.31, p = .041) were significant positive predictors. Weekly social media hours was not a significant predictor (B = -0.30, p = .678).
Then give the interpretation in plain language: "Holding attendance and social media use constant, each additional weekly study hour was associated with about 1.85 more points." Put the full tables in the results chapter and keep the paragraph for the reading. The results chapter guide covers where to place tables and how to avoid repeating them line by line. If your department uses a particular reporting style (APA or otherwise), follow it; the exact table format and decimal places vary.
Link each result back to your objective or hypothesis, and say whether it is supported. Do the discussion in the next chapter; the discussion and conclusion guide helps.
What mistakes do supervisors flag in regression write-ups?
- Causal language from survey data. Words like "causes", "leads to" or "impact" overstate what regression coefficients show. Regression does not establish causation, and an observational survey will usually be missing confounding variables. Prefer "predicts", "is associated with" or "is related to", and mention the design as a limitation.
- Too many predictors for the sample. Every predictor you add costs reliability, and R-squared rises just from adding variables. Keep the model to predictors justified by your objectives and literature, and ask your supervisor what your sample can support. See the sample size guide for the planning principle.
- Reading only R-squared. A high value can hide a misspecified model, outliers or collinear predictors. Look at the coefficients and the residual plots too.
- Treating "not significant" as "no effect". It means the data were not clear enough, which also depends on sample size.
- Interpreting each B alone. In a multiple model, every coefficient is conditional on the others. Say so.
- Ignoring units. A B of 1.85 is meaningless without "per weekly hour" and "score points".
- Confusing correlation output with regression output. In simple regression R-squared is the square of Pearson's r, but the interpretation and the equation belong to regression; do not copy a correlation paragraph into the regression section.
- Fitting Likert items as if they were measured outcomes without discussion. If your variables are scale scores built from Likert items, explain how they were built. The Likert scale analysis guide covers this.
- Dropping the assumption checks. Even one sentence on how you checked linearity, residual spread and multicollinearity shows the work was done.
What might a supervisor or panel ask?
Prepare short answers, in your own words, to questions like these:
- Why regression and not a t-test or correlation for this objective?
- What is the dependent variable and how was it measured?
- What does the coefficient for your main predictor mean, in units?
- Why is the intercept (or a particular coefficient) negative or not significant?
- What is the difference between R-squared and adjusted R-squared?
- Which assumptions did you check, and what did the plots show?
- Can you say your predictor caused the change? Why or why not?
- Why did you include these predictors and not others?
If you cannot answer one of them from your own output, return to the analysis before the defence rather than rehearsing a script.
A short checklist before you submit
- Dependent variable is numerical and clearly defined; predictors are named in the objectives.
- Data cleaned, variables described, correlations between predictors checked.
- Assumption checks run and a sentence written about each.
- Model summary, F test and coefficients all reported from the same run of the software.
- B values interpreted with units and "other predictors held constant".
- Language avoids causal claims your design cannot support.
- Every number in the text matches the original output.
- Tables and figures follow your department's format; for formatting help see the free formatter and your department's own instructions.
Where UniDraft fits in
UniDraft organises your confirmed methods, verified results, checked sources and supervisor instructions into an editable Word project document, so your regression write-up sits in the right chapter with the rest of your work. Start your project document when your output is verified. For the wider method choices behind your analysis, see the quantitative research methods guide.
Unsure which variable goes where? Start with independent and dependent variables.
Sources
- Wikipedia: Linear regression: simple versus multiple regression, meaning of a coefficient with other predictors held fixed, and the caution that regression does not establish causation.
- Wikipedia: Coefficient of determination: definition of R-squared and adjusted R-squared, why R-squared rises when predictors are added, and cautions about interpretation.
- NIST Engineering Statistics Handbook: Residual analysis: residuals as the way to check linearity, constant variance, independence and normality, and why a high R-squared alone does not show a good fit.
The coefficient table in this guide is fictional and for layout only. Confirm test choices, assumptions, significance level and reporting style with your supervisor.